Skip to main content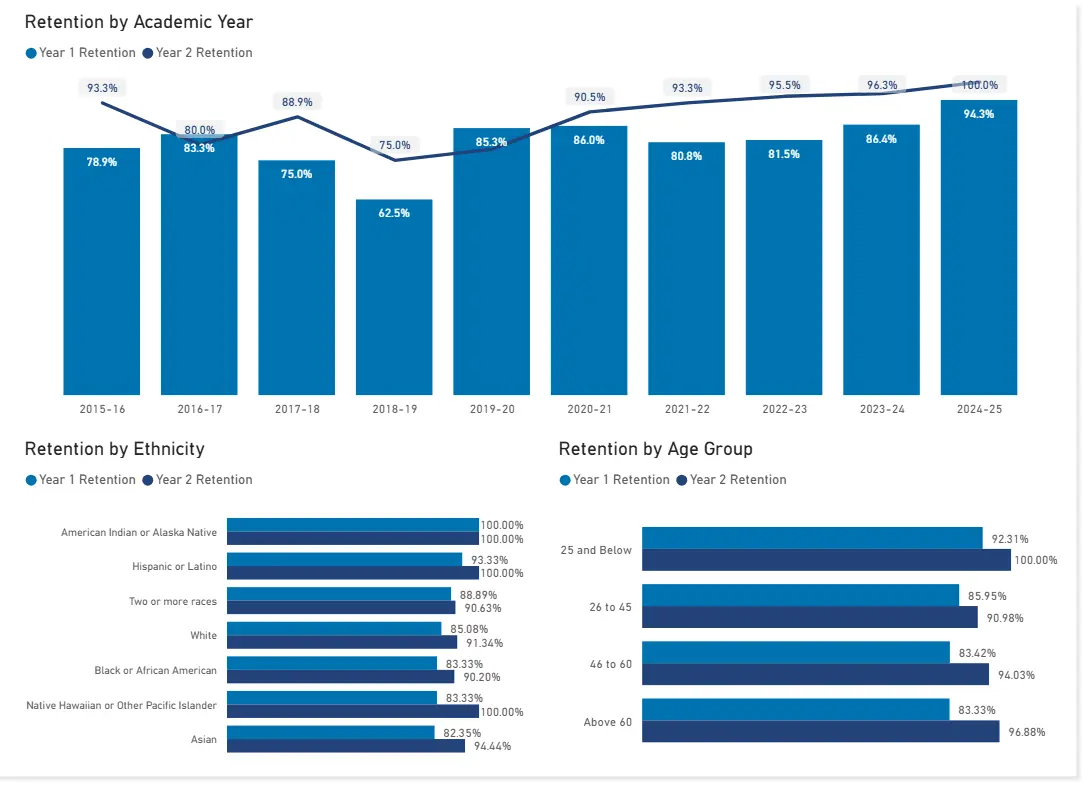


Student Retention, Graduation, and Program Completion Times
Meridian faculty and staff are dedicated to providing the advising and support students need to accomplish their educational and professional goals. Faculty seek to provide students with a stimulating learning environment, enriched by the facilitation of strong faculty and peer connections.
Meridian offers a learning format that supports non-traditional and life-long post-bachelors learners, providing students with the support and flexibility that can help in balancing the pursuit of educational goals with professional, personal, and family commitments. For these reasons, the completion timeframe of Meridian students may vary from traditional university students.
Retention
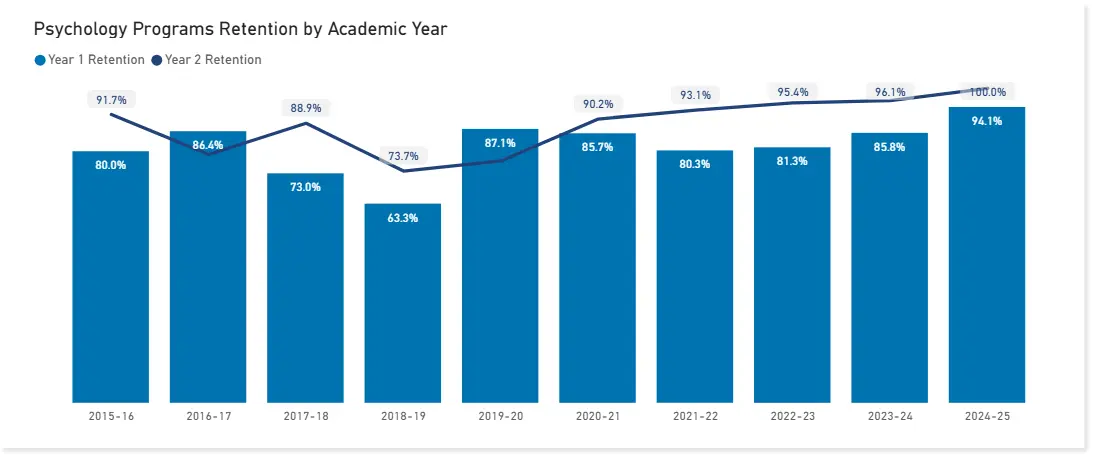
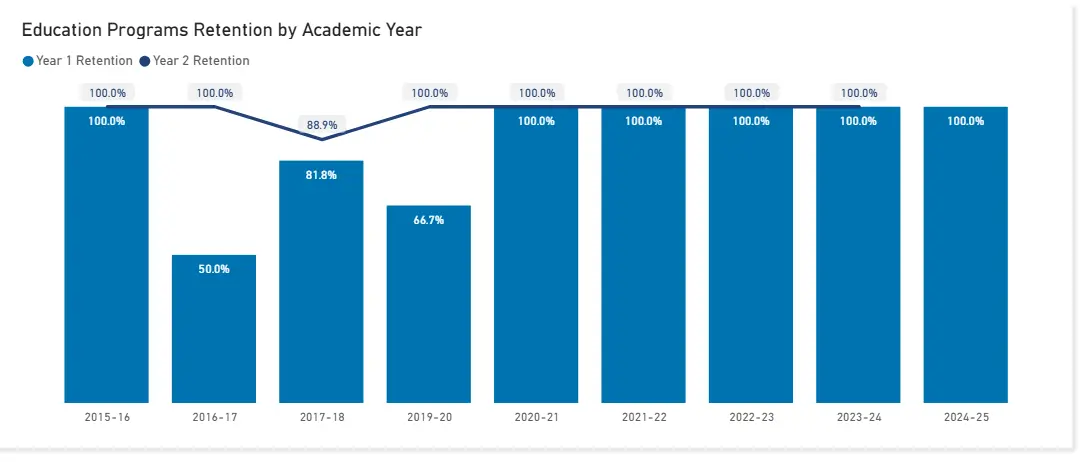
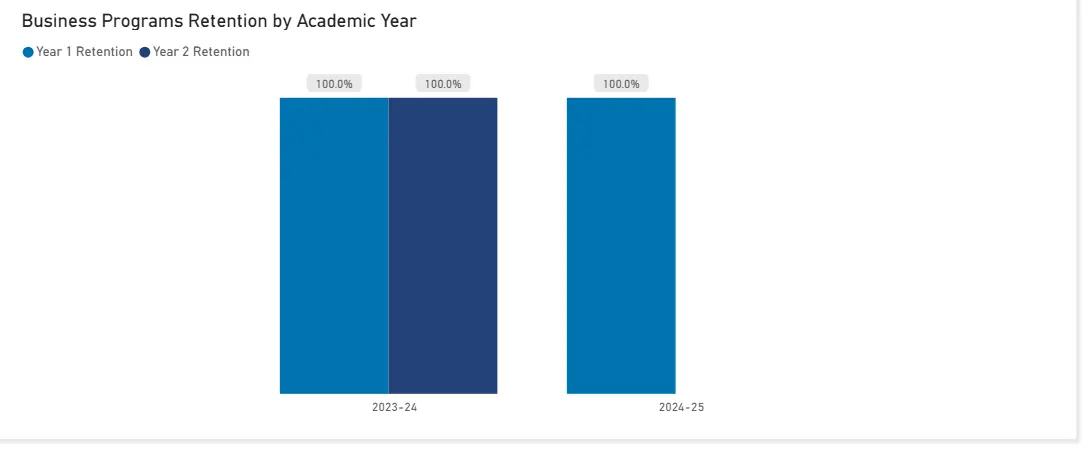
Retention rates are calculated each academic year per entering ‘cohort’, for the first and second year and are determined by the number of students who have completed an attempt of at least one course and who remain enrolled for at least a year. Meridian consistently maintains high retention rates, though small sample sizes in some programs make certain statistics less meaningful.


Completion Rates
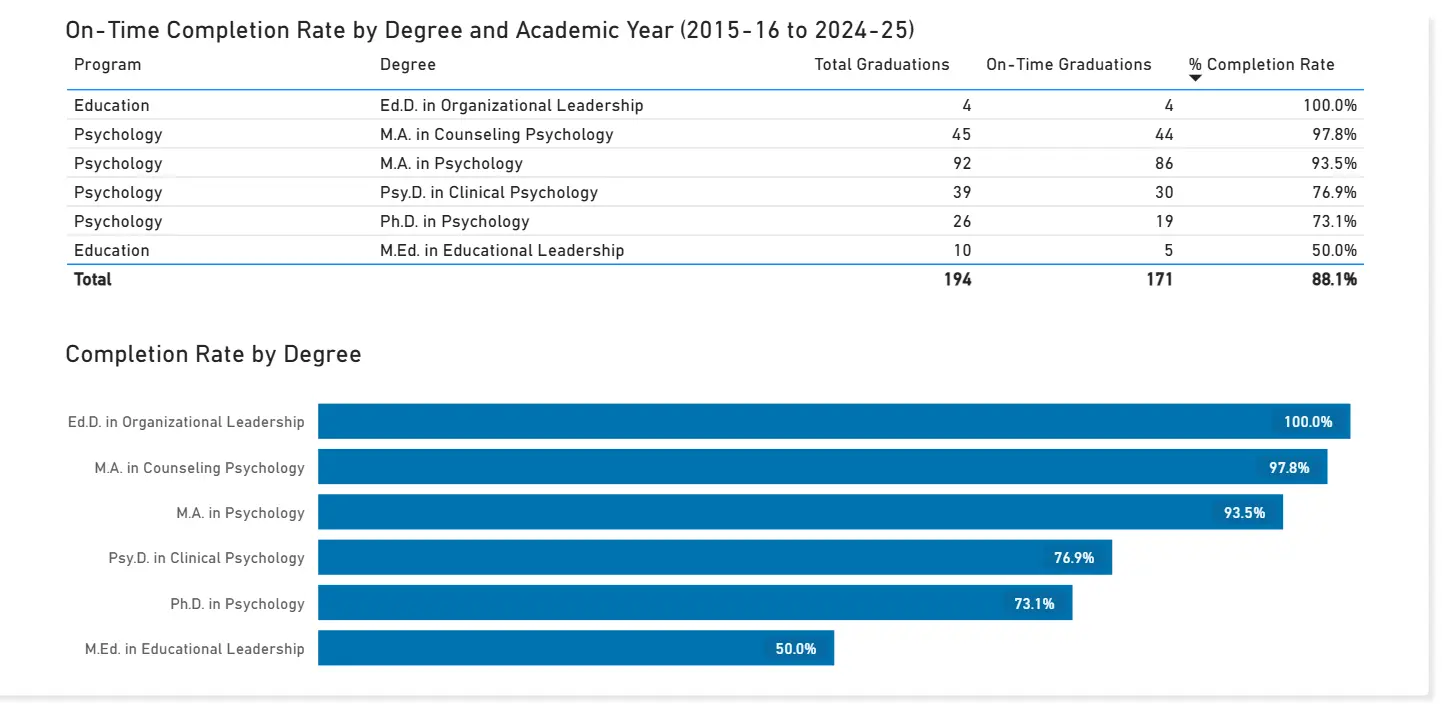
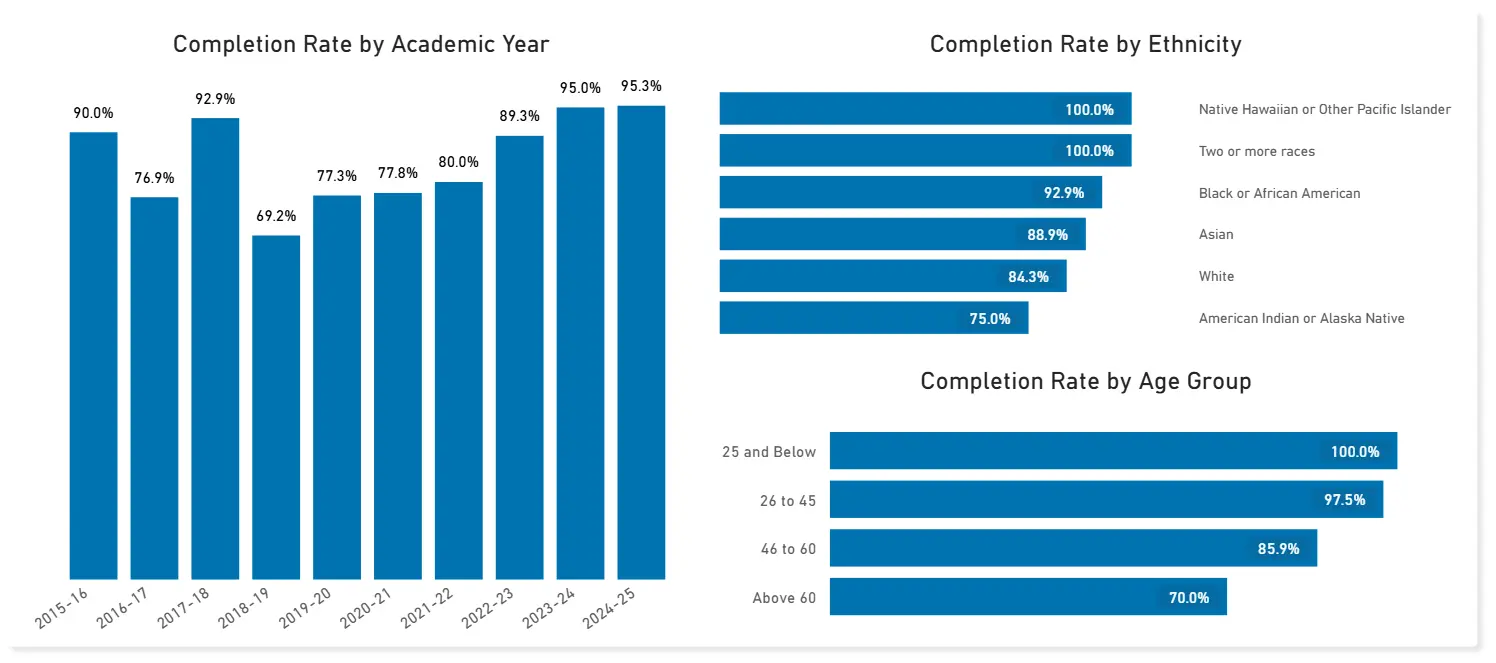
Completion rates are calculated based on the number of graduates completing their degree within the max time to complete divided by the total graduates, per Academic Year. The “Total Graduations” is the number of students completing the degree within the academic year. The “On-Time Graduations” is the number of students who completed the program within 100% of the maximum time to complete. Some students may not have completed within this time frame but may still be making progress towards completion. Small sample sizes amongst some demographics affect the quality of statistical analysis.
Note that in 2018-19, Meridian substantially reduced the max time to complete values for each degree. Meaning, students now have less time to graduate 'on-time' than in years past. This amounts to embracing more ambitious targets for student success and reduces the percentage of students shown as 'on-time' in all displayed years. Also, note that if a student withdrew from their degree program and then re-enrolled at a later time, then an updated maximum completion time is applied.


Student Engagement Rates
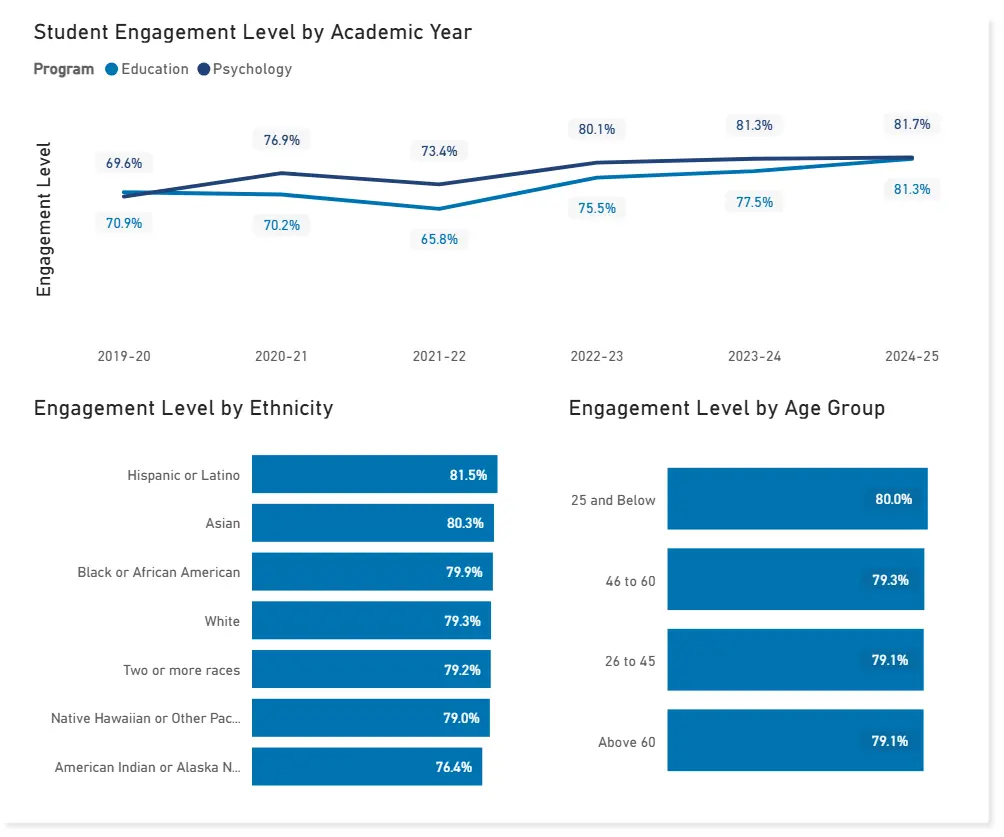
Faculty use a database-driven method to track student engagement within every course module and analyze how student engagement impacts grade distribution and student success generally, as well as tracking the degree to which course modules are valuable and engaging for the students. Small sample sizes amongst some demographics affect the quality of statistical analysis.

Grade Distribution
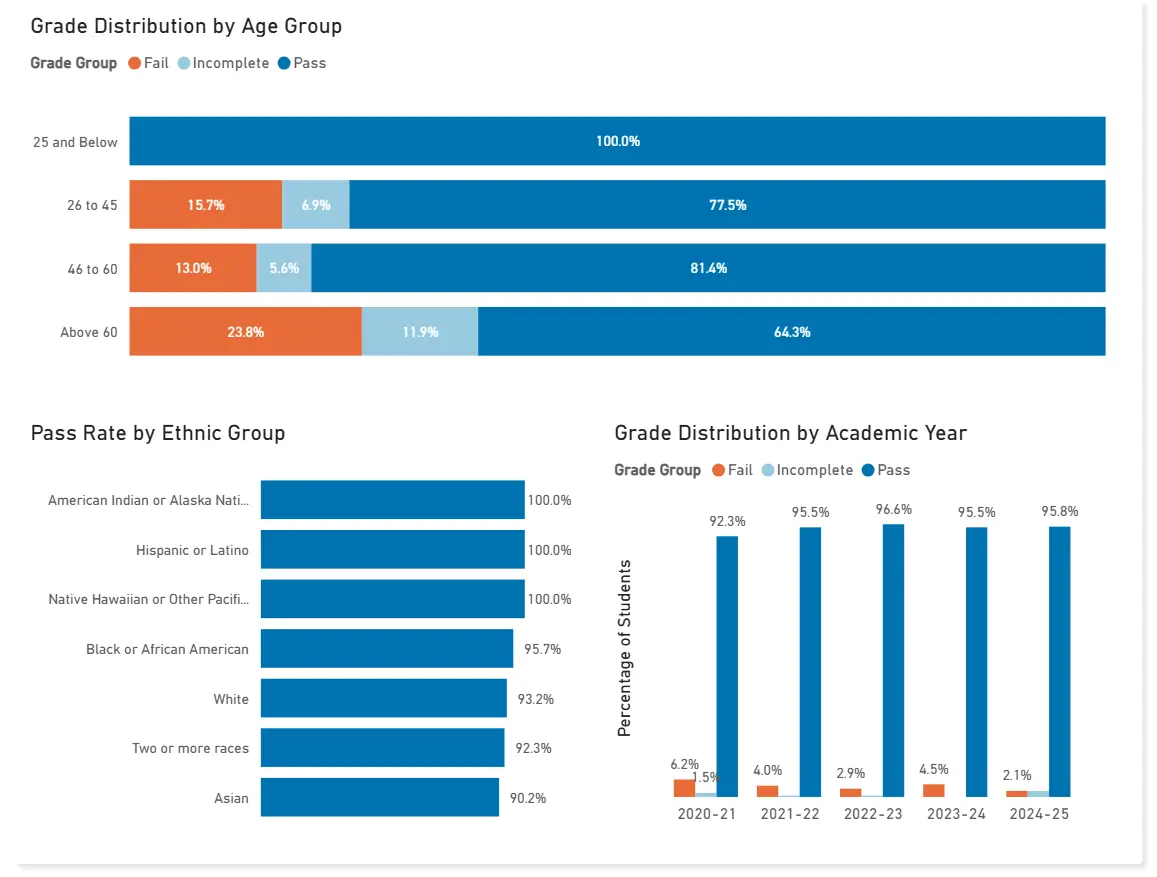
By assessing the current grade distribution across Academic Year, Program and Demographics we can visualize the effectiveness of the courses available and improve faculty and staff teaching and support services. This dataset begins in 2019, when the University adopted a new database system. Small sample sizes amongst some demographics affect the quality of statistical analysis.
Note that 'Low Pass' grades are combined with Pass grades and that Incomplete grades that have already been remediated are displayed as Pass grades.

ARMS Assessments
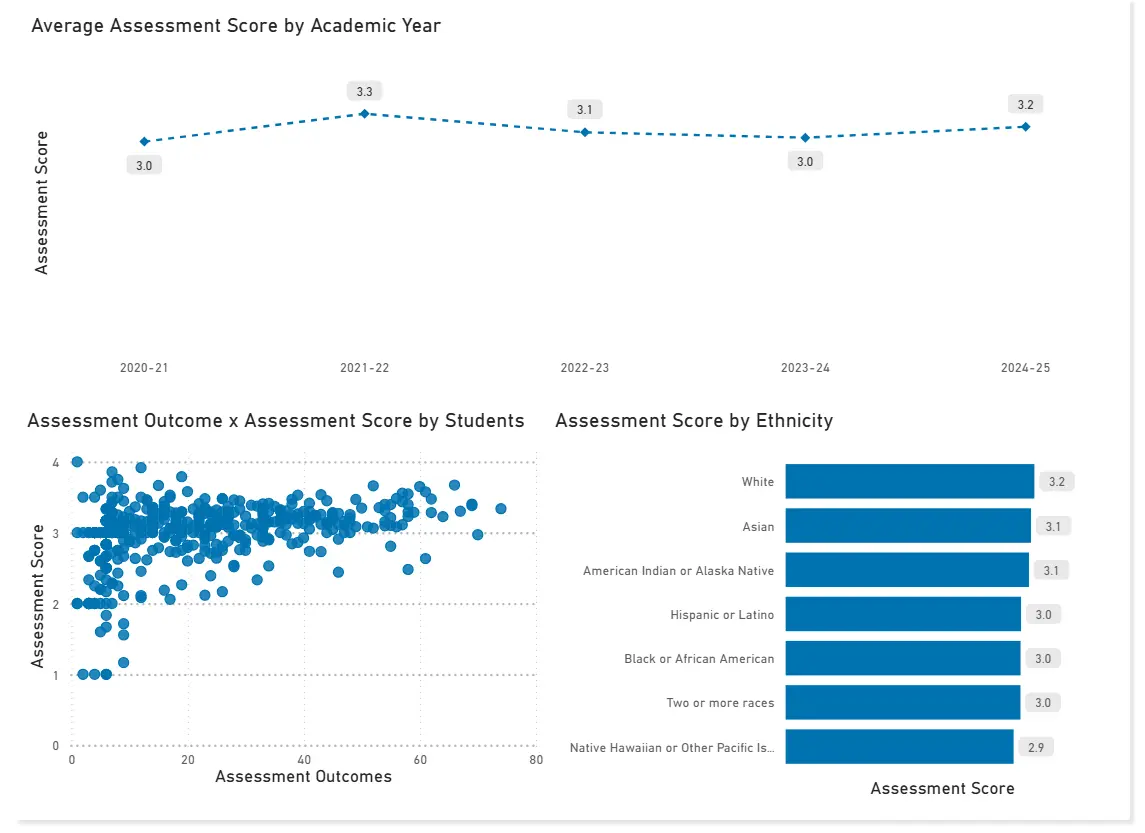
Using a new database system, in recent years staff and faculty have been able to collect and collate the individual Assessment and Rubric Management System (ARMS) assessment outcomes to track student performance over time and across demographics.
The scoring system used can be summarized with the following key:
- Initial - 1
- Emerging - 2
- Proficient - 3
- Advanced - 4
The averages visualized below provide a high-level overview of the University’s dataset and demonstrate the students’ average assessment scores across academic quarters.

Licensure Pass Rates and Placement
Meridian students are consistently successful on California’s MFT and Psychologist licensing exams (Board of Behavioral Science (BBS) and Board of Psychology (BOP), respectively), scoring well above statewide averages.
Board of Behavioral Science (BBS) MFT Licensure Exam Pass Rates (6 year cumulative)

Licensing data has been released by the boards through 2024; exam pass rates will be updated as the data becomes available.
Reference: http://www.bbs.ca.gov/exams/news.html
Board of Psychology (BOP) Psychologist Licensure Exam Pass Rates (5 year cumulative)

Licensing data has been released by the boards through 2024; exam pass rates will be updated as the data becomes available.
Reference: http://www.psychology.ca.gov/applicants/exams/statistics.shtml
Note Regarding Placement
Meridian offers no guarantee of a position or employment for students, both while enrolled and subsequent to graduation. However, Meridian alumni have gone on to pursue diverse careers after completion of their degree.
Graduate Admissions
Learn More
Interested in learning more about the programs at Meridian?
email an advisor »schedule a call »